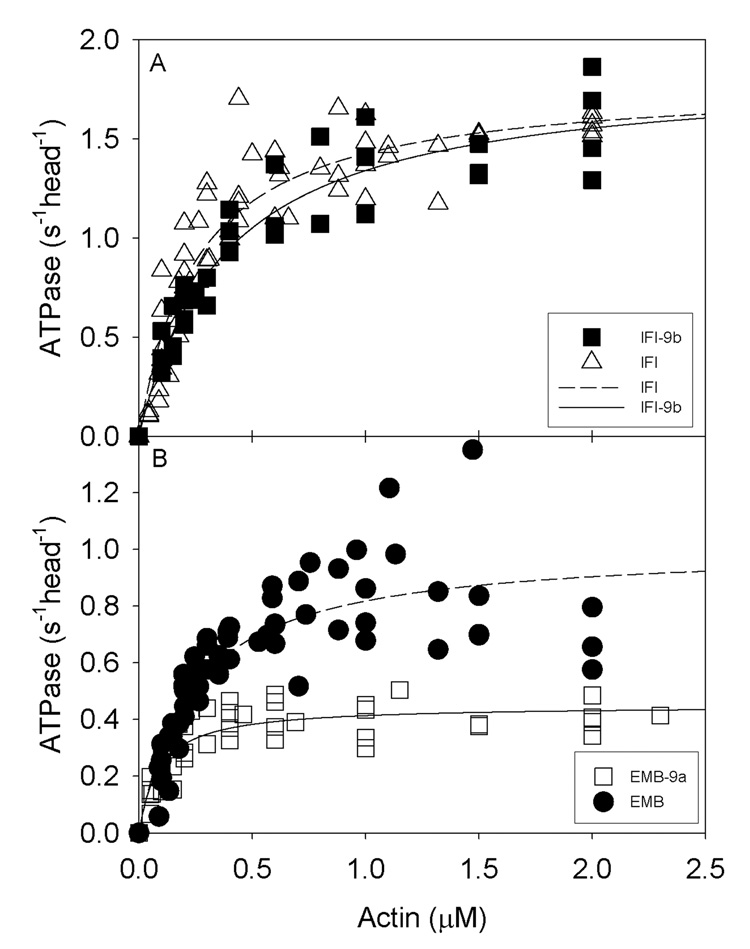
Figure 1. Actin-stimulated Mg-ATPase activity of wild-type and chimeric myosins.

Mg-ATPase activities of myosins isolated from the four transgenic lines were determined as described in Materials and Methods. The concentrations of chicken actin used ranged from 0–2 µM. Basal Mg-ATPase activities obtained in the absence of actin were subtracted from all data points, which were fitted with the Michaelis-Menten equation (rectangular hyperbola, y = ax/(b + x)). A, IFI (n = 9) and IFI-9b (n = 4) actin-activated MgATPase activities show negligible differences. B, EMB (n = 7) and EMB-9a (n = 5) actin-activated Mg-ATPase activities. Vmax and Km for EMB-9a are substantially reduced compared to EMB (see Table 2).
