
Fig. 4.
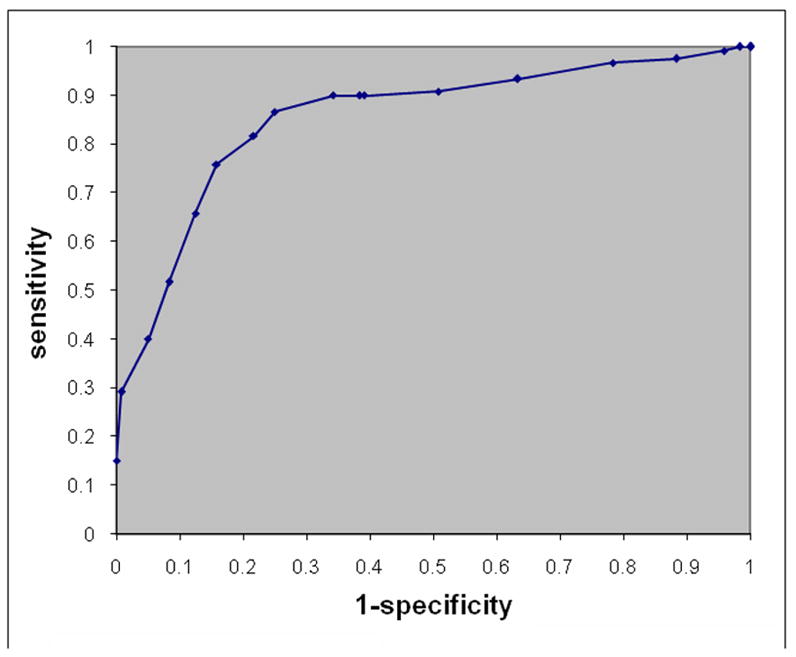
ROC curve showing the sensitivity and specificity in differentiating between FTD and AD. Sensitivity here reflects the percent of FTDs that were correctly classified as FTD against a background group of AD, and specificity reflects the percent of AD participants correctly classified as AD. The ROC curve was obtained by varying the classification threshold applied to the SVM decision function.