
Fig. 7.
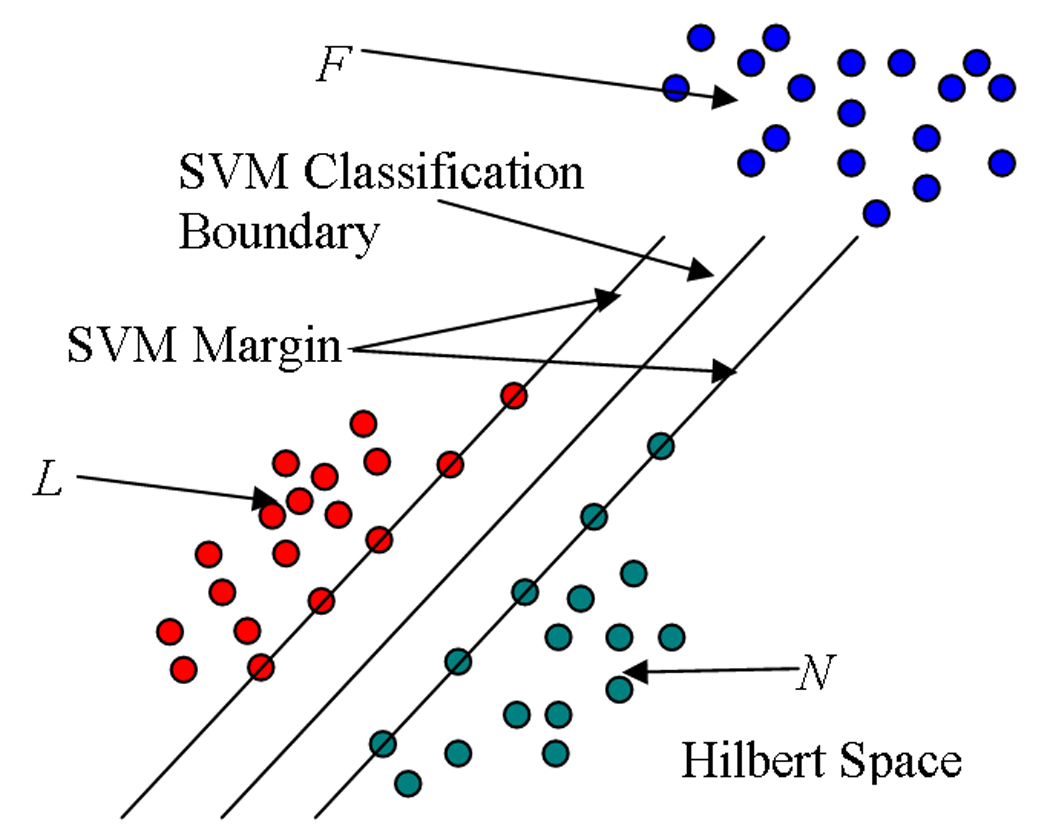
Illustration of L, N and F distribution in Hilbert space. Green and red represent AVs of healthy and lesion tissue, respectively, whereas blue represents AVs of voxels that are misclassified mostly because minor registration errors between the 4 different acquisitions (T1, T2, PD and FLAIR) causes them to have imaging profiles that are drastically different from the training set, and hence prone to misclassification.