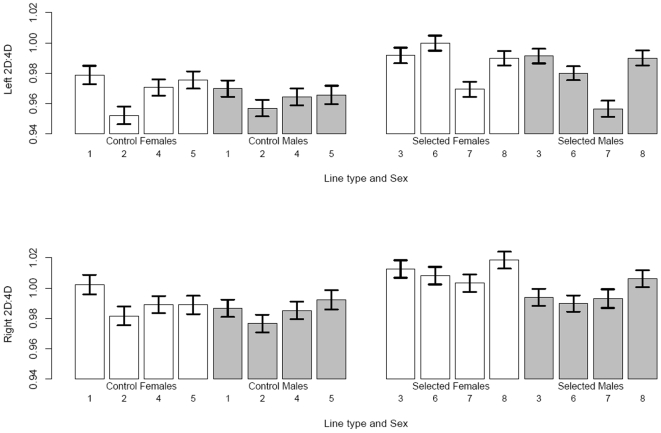
Figure 2. Digit ratios by sex and selection line.
2D∶4D finger length ratios by sex and selection regime for the eight lines of mice. Control are lines 1, 2, 4 and 5 (lab designations), High Runner selected lines are 3, 6, 7 and 8), open bars indicate females, and shaded bars males. Values are least square means and associated standard errors from models (separately for Control and Selected lines) including sex, line, sex-by-line interaction, and generation as fixed effects (SAS Procedure Mixed: family nested within line and the sex-by-family(line) interaction were random effects). See text for P values and for results of analyses comparing the four Control with the four High Runner lines.

