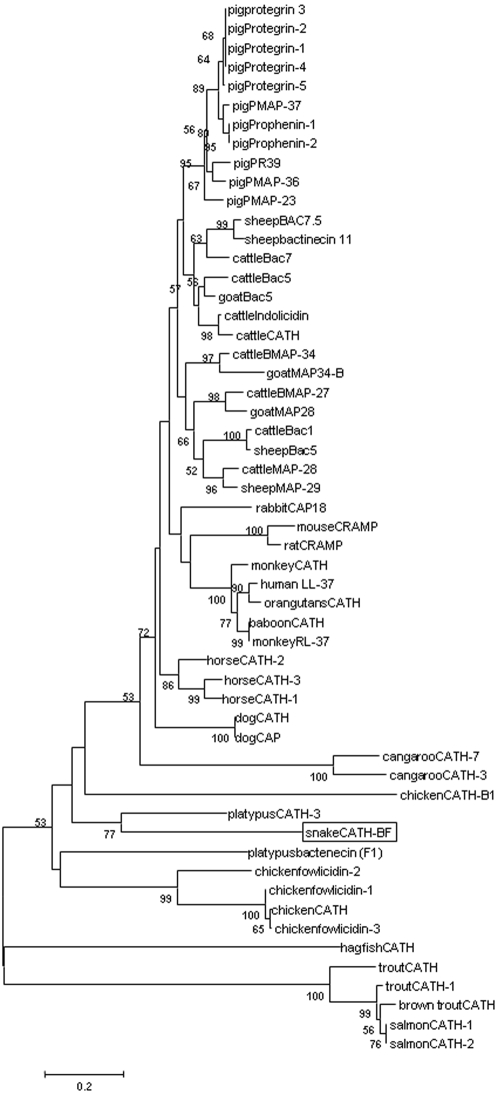
Figure 3. Phylogenetic analysis of cathelicidins.
Phylogenetic dendrogram obtained by neighbour-joining analysis based on the proportion difference (p-distance) of aligned amino acid sites of the full-length peptide sequences. Only bootstrap values >50% (expressed as percentages of 1000 resamplings) are shown at branching points. Snake cathelicidin-BF is boxed.

