
Figure 5.
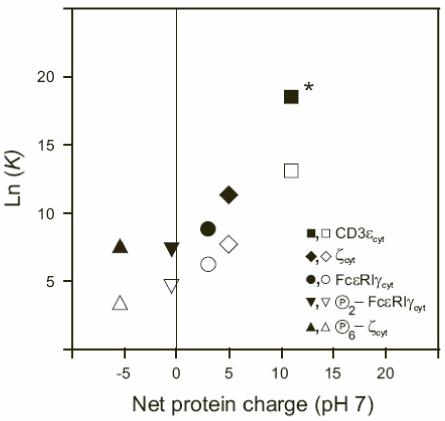
The membrane binding of the cytoplasmic domains increases as the net charge of the protein increases. The filled and empty symbols are the logarithmic values of the molar partition coefficients K (M-1) determined from experimental measurements of the binding of ζcyt (net charge of +5), FcεRIγcyt (net charge of +3), CD3εcyt (net charge of +11) as well as fully phosphorylated ζcyt (net charge of -5.5) and FcεRIγcyt (net charge of -0.5) to POPG (filled symbols) and 1:1 POPG/POPC (empty symbols) LUV in 1 mM MOPS, 100 mM KCl, pH 7.0. * Estimated from the curve fit.