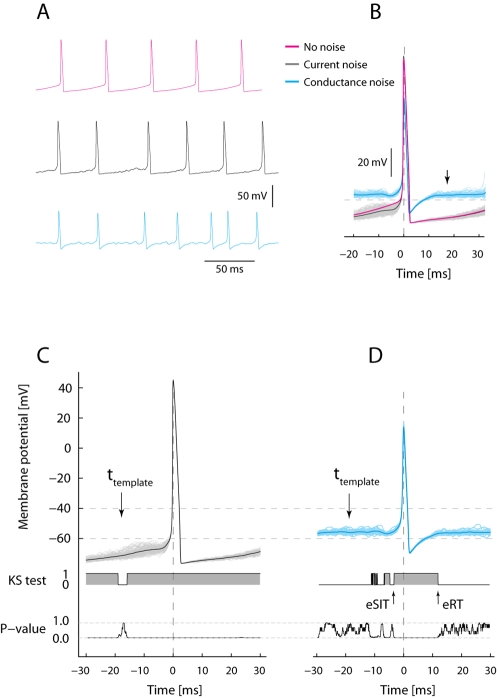
Figure 1. Computer simulation to illustrate firing pattern and AHP in current-based and conductance based models of synaptic input during repetitive firing.
(A). Red top trace: Model with constant current injection, no other input. Black middle trace: Model with added current noise with same mean current as in top trace. Blue bottom trace: Model with same mean injected constant current and noise stemming from fluctuating conductance. (B). Spike triggered superimposed spikes. Red, black (n = 243) and blue (n = 72) traces are averages of spikes from (A). Notice the current-noise average closely overlap the no-noise trace (red) whereas the conductance-noise average (blue) rapidly reach pre-spike Vm-level (see arrow), because of increase in total conductance. (C) and (D) illustrate the statistical quantification of the evolution of Vm before and after the spike for traces in (B). A template distribution of Vm traces is chosen at an arbitrary time prior to the spike (see arrow at ttemplate) for which the distribution at the rest of the time points is compared with. The outcome of comparison is shown as the KS-test trace below, 1 represents acceptance and 0 represents rejection of the hypothesis that they are different. Below is shown the P-values for the KS test. The distribution of Vm in (C) is different everywhere, whereas the distribution in (D) is only different up to and immediately after the spike. The time it takes to regain the pre-spike distribution following the spike is referred to as effective recovery time (eRT, arrow), while the endmost time of same distribution before the spike is referred to as effective synaptic integration time (eSIT, arrow).

