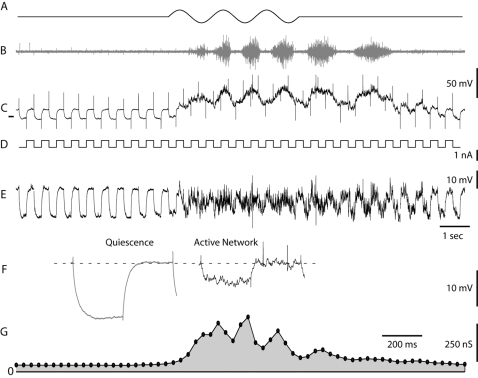
Figure 2. Increase in synaptic conductance during a single scratch epoch.
(A) Cutaneous stimulation via sinusoidal movements of a glass rod on the hind-limb pocket skin. (B) Electro-neurogram from hip flexor nerve. (C) Vm from intracellular recording. Tick mark indicates Vm of −100 mV. (D) Current pulses of −0.7 nA from constant current level of −1.0 nA. (E) High-pass filtered Vm from (C) (cut off is 2 Hz). Transient artifacts removed. (F) left, average voltage deflections from (E) during quiescence (n = 14), right during network activity (n = 14). The average increase in conductance is 340%. Notice the occurrence of two spikes. (G) The membrane conductance as a function of time. The peak conductance during network activity is >800% of the conductance during quiescence.

