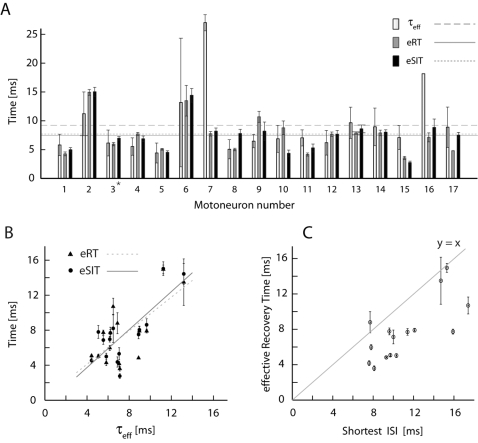
Figure 5. Time constants across the population of MNs.
(A) The average τeff (for ON-cycle), eRT and eSIT (mean±SE) as triplets bars for each cell. Horizontal lines represent population averages, μ = 9.5 ms for τeff, μ = 7.5 ms for eRT, and μ = 7.7 ms for eSIT. Cell 3 is marked with a ★ and the sample cell used in figures 3, 4, 5. (B) eRT and eSIT plotted against τeff show significant correlation. The lines are linear least square fits. (C) The shortest ISI at zero current injection plotted against the average eRT for each MN. Gray line is where x = y.

