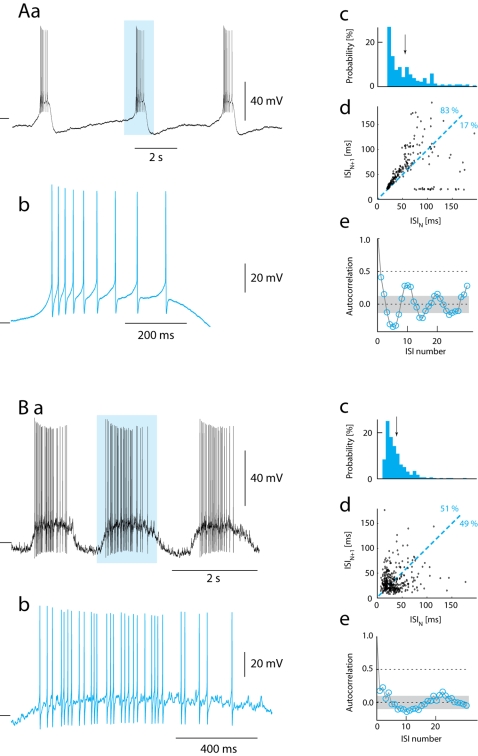
Figure 6. Presence and absence of spike frequency adaptation (SFA) during bursting.
(Aa) SFA in intracellular recording from motoneuron in slice during NMDA induced bursting. (Ab) Single burst highlighted in (Aa) show gradual increase in ISI. (Ac) Histogram of ISI. The mean ISI is 55 ms (arrow). (Ad) Plot of ISIN against ISIN+1 shows significantly greater proportion of points above than below the ISIN = ISIN+1 line (83.2% above, total N = 239), which is evidence of spike frequency adaptation. In addition, ISIs are correlated with their neighbors (correlation coefficient = 0.41), as expected when ISI are influenced by AHP conductance and the burst pattern is reproduced after 10 spikes (Ae). Gray area represents the 5% confidence limit  (Ba) Recording from a MN in a functional spinal network during rhythmic motor activity. (Bb) A hightligted cycle from (Ba) shows irregular spike times and no SFA. (Bc) Histogram of ISI. The mean ISI is 34 ms (arrow) (Bd) A plot of ISIN against ISIN+1 illustrates no discrepancy of points above and below the ISIN = ISIN+1 line (51.3% above, total N = 362), which demonstrates absence of SFA. Furthermore, there is only a marginal correlation of ISI with neighbors (correlation coefficient = 0.18), as expected with negligible AHP conductance (Be). Gray area represents the 5% confidence limit
  . Tick marks to the left represent −80 mV (A) and −60 mV (B). Inter-burst-intervals are omitted in analysis.

