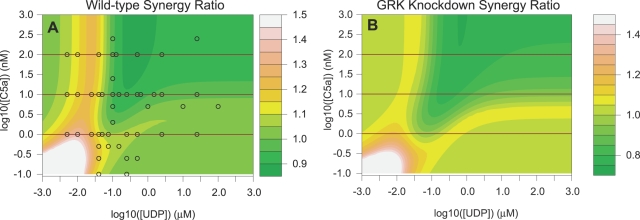
Figure 5. The model is used as a predictive tool to infer the effect of stimulating the cell simultaneously with UDP and C5a that signal through the Gαq and Gαi pathways, respectively.
Synergy was measured as the ratio of peak height offset from baseline attained from simultaneous stimulation to the peak height offset calculated by the sum of the responses to each ligand individually. (A) Expected synergy ratio as a function of UDP and C5a dose (truncated at 1.5). The simulations show a ridge of synergy at a moderate UDP dose for most C5a doses. The black circles indicate dose combinations points of experiments that were conducted to test the model. (B) Expected synergy ratio as a function of UDP and C5a dose for a simulated GRK2 knockdown cell line. Without the GRK-mediated negative feedback to keep the IP3 generation from the C5a receptor within the non-linear range of calcium release the ridge in the synergy dose response is diminished. The synergy in the GRK knockdown simulation is not entirely eliminated because the shRNAi knockdown of GRK does not constitute a complete loss-of-function and low concentrations of ligand are still able to synergize. Furthermore, the asymmetric synergy dose response surface is more symmetric in the GRK knockdown simulation because the asymmetric calcium-dependent feedback mechanism is reduced.

