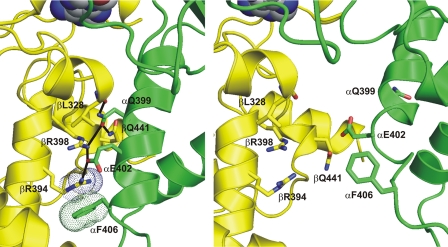
FIGURE 1.
The βDP/αDP hydrogen-bonding network. The βDP/αDP hydrogen-bonding network is shown in the left-hand panel. Protein backbone and selected side-chain carbon atoms of the β subunit are depicted in yellow;inthe α subunits, these elements are shown in green. Oxygen atoms are in red, nitrogen atoms in blue. The catalytic-site-bound nucleotide is visible at the top of the figure in “space-fill” representation. Possible inter-subunit hydrogen bonds are indicated by black lines. The “dots” represent the van der Waals radii of the guanidino function of βR394 and the phenyl ring of αF406, showing how these groups form a cation/π interaction. For comparison, the right-hand panel shows the same residues at the βTP/αTP interface, which lacks the hydrogen-bonding network. The figure was generated using PyMOL (W. L. DeLano (2002) PyMOL, DeLano Scientific, San Carlos, CA).

