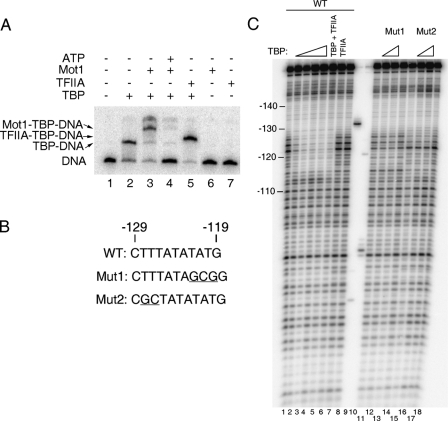
FIGURE 2.
Interaction of TBP with the URA1 promoter in vitro. A, electrophoretic mobility shift assay using radiolabeled URA1 promoter DNA. TBP (14 nm) was incubated with the probe for ∼20 min at 22 °C, followed by the addition of Mot1 (9.2 nm), TFIIA (10.5 “units” of recombinant TBP-DNA binding activity (54)), and/or ATP (25 μm) for 5 min prior to loading on the gel. Arrows indicate the positions of the TBP-DNA, Mot1-TBP-DNA, and TFIIA-TBP-DNA complexes. B, sequences of the TATA regions of the WT, Mut1, and Mut2 probes used for footprinting. Mut1 alters both putative TATA sequences; Mut2 eliminates only the reverse TATA sequence (see Fig. 1B). Deviations from the WT sequence are underlined. C, DNase I footprinting experiment in which TBP was incubated with URA1 DNA. The reactions contained 5.6, 14, 33.6, 56, and 14 nm TBP in lanes 2-6, respectively. Reactions in lanes 12 and 16 contained 14 nm TBP; reactions in lanes 13 and 17 contained 33.6 nm TBP. Reactions in lanes 7 and 8 contained 12 units of TFIIA. Lanes 9 and 10 show markers obtained by restriction enzyme digestion of the URA1 probe and were used to assign positions of the other bands on the gel. Note the TBP footprint from -127 to -115 (with respect to the start codon) that was observed using the WT probe only.

