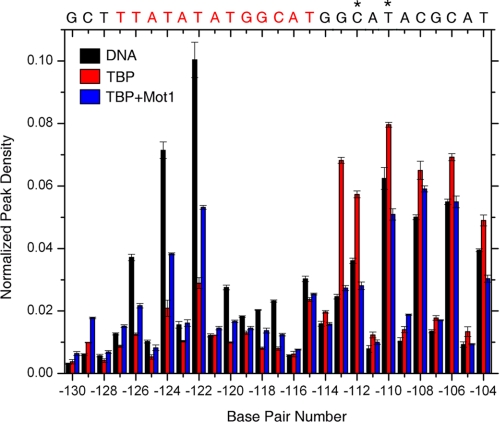
FIGURE 4.
Quantitation of URA1 DNase I footprinting results. The graph shows the relative band intensities measured from the gel image shown in Fig. 3B, lanes 1-6, obtained by single band peak fitting (49, 55). Note that the addition of Mot1 resulted in suppression of DNase I digestion at downstream positions, but at only two positions (asterisks) was the digestion reduced below the level of digestion seen in reactions with DNA alone. Thus, Mot1 reduced the enhanced downstream digestion attributable to TBP, rather than generating a true extension of the TBP footprint.

