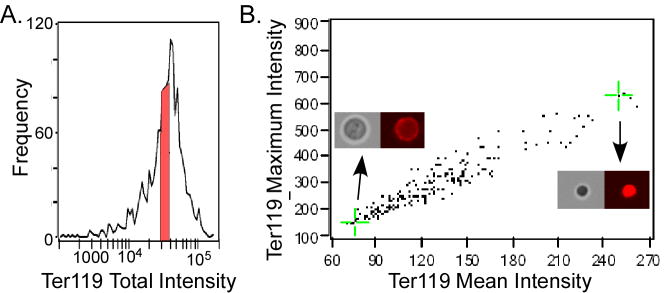
Figure 2.
Discrimination of cells with alternative intensity measurements. A. Histogram of total Ter119 intensity per cell of Ter119-positive cells from murine bone marrow. A subpopulation of cells with similar (< 2-fold) levels of Ter119 intensity selected to be plotted in B is indicated in red. B. Cells selected in A were plotted by Ter119 mean and maximum intensity producing a continuum of less mature big and Ter119-dim (bottom right insert) to more mature small and Ter119-bright cells (top right insert). Green crosshairs and arrows indicate where the cells visualized in the inserts are located in the graph.

