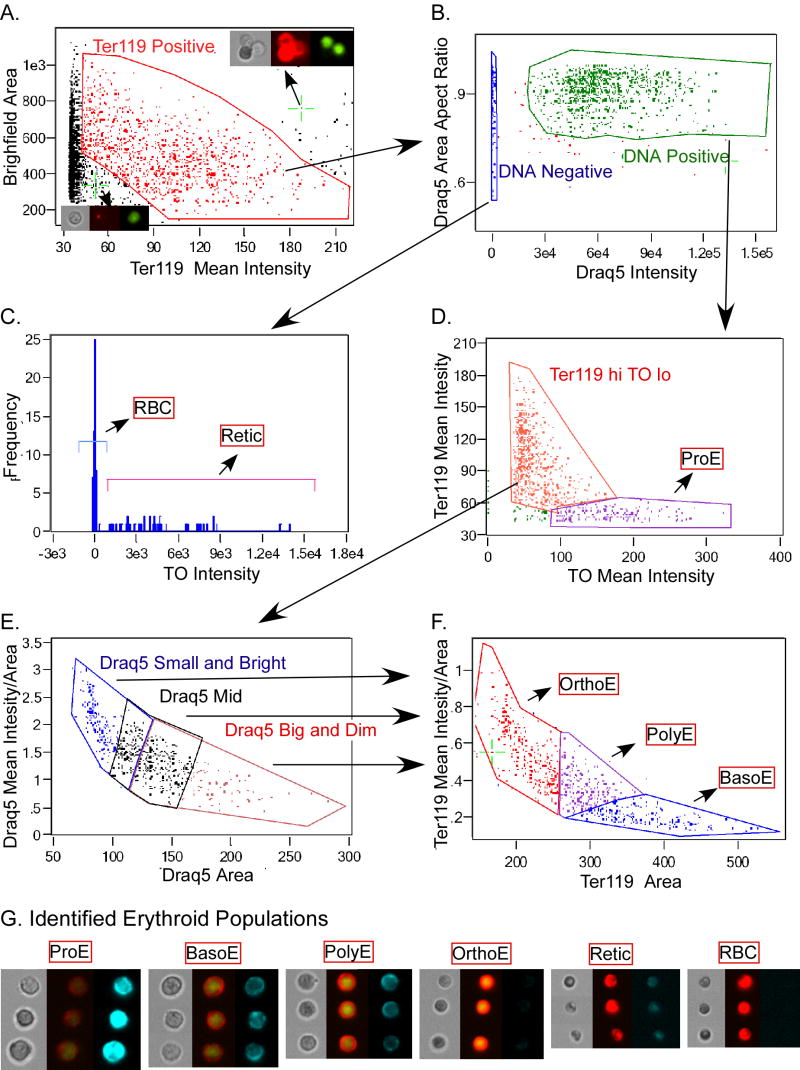
Figure 3.
Erythroid intermediates as delineated by ImageStream analysis utilizing IDEAS 2.0 software. Murine bone marrow cells were stained with the RNA stain thiazole orange (TO), biotinated Ter119 revealed by PE-Texas Red streptavidin and the DNA stain Draq5. Multispectral imaging of cells was carried out on the ImageStream and the data files were compensated as published (George et al., 2004; Ortyn et al., 2006). Initial gating removed images containing multiple cells and out of focus cells and the resultant file of single cells was analyzed by the gating strategy shown in panels A to F and discussed in the text. Arrows indicate cell populations that were plotted in successive graphs. In A, green crosshairs and arrows indicate where the cells visualized in the inserts are located in the graph (left brightfield, middle Ter119, right Draq5). Final populations are indicated by red-boxed names. Panel G contains 3 examples each of identified erythroid cell intermediates. Triple panels of images are brightfield (left panel), combined Ter119 (red) and Draq5 (green) (middle panel), and TO (right panel). The sensitivity of the thiazole orange images was increased equally for the reticulocyte and RBC images to emphasize the residual TO staining evident in the reticulocytes.

