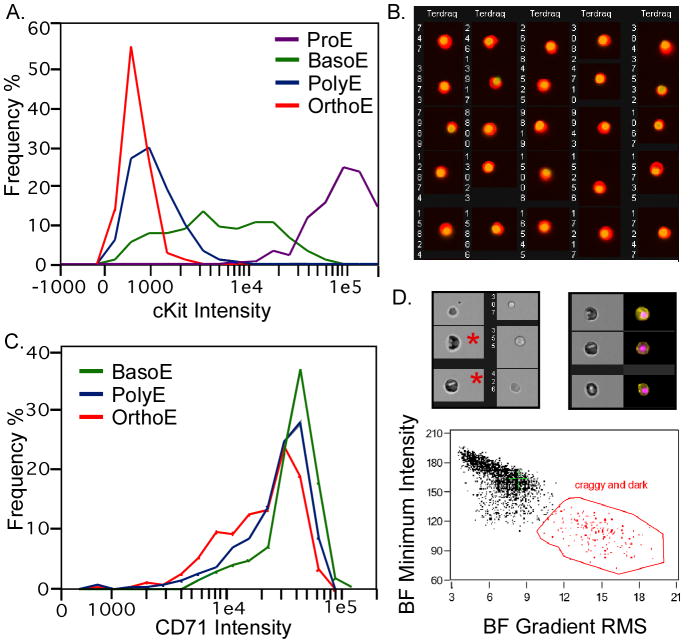
Figure 4.
Analyses of erythroid populations utilizing the ImageStream. A. Total intensity levels of cKit (PE-CD117) intensity were graphed for four erythroblast populations (containing 1246 total cells) as determined in Figure 3. As expected, proerythroblasts have the highest cKit levels, with the basophilic erythroblasts having lower levels as cKit is down-regulated during erythroid maturation. B. Asymmetry of nuclei was calculated using morphology masks and the following equation (square root ((delta center x Ter119 vs. Draq5)2+(delta center y Ter119 vs. Draq5)2)/ area Ter119). Cells with asymmetric nuclei are shown. A large majority (>87%) were classified as orthochromatic erythroblasts consistent with the known biology of those cells. C. Total intensity levels of CD71 were graphed for three mid maturation stages of erythroblasts (containing 1315 total cells) classified as in Figure 3. While there was an some decrease in CD71 as cells mature from basophilic, polychromatophilic to orthochromatic erythroblasts, large overlap in CD71 intensity makes it a poor discriminator of these stages of erythropoiesis. D. Fixed murine fetal liver cells stained with Ter119, Draq5 and with antibodies to embryonic erythroid specific εy-globin (McGrath et al., 2007) were analyzed by ImageStream. Orthochromatic erythroblasts of the embryonic (primitive erythroid) lineage are very rare in the fetal liver, but have a diagnostic dark and craggy appearance in bright field images (asterisks in upper left image). These characteristics can be plotted as brightfield minimum intensity and Gradient RMS brightfield (lower graph) allowing the gating of a cell population that contains embryonic erythroblasts (upper right image, brightfield and combined εy-globin (yellow) and Draq5 (pink) images).

