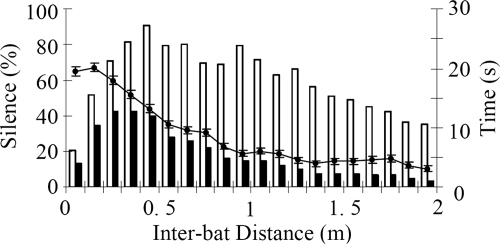
Fig. 2.
The relationship between the percentage of silent time and inter-bat distance. The percentage of silent time was calculated by dividing total duration of silent time by total trial time. Data, taken from a total of 441.27 s across 152 trials with 7 pairs of bats are included. Error bars represent standard errors of the mean. The percentage of silent time as a function of inter-bat distance (filled circles, left ordinate). The histogram shows on the right ordinate the total trial time (white) and duration of silent times (black).

