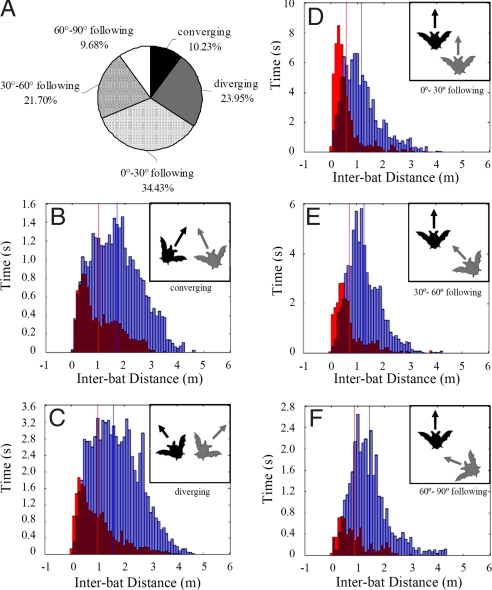
Fig. 3.
The proportion of each flight pattern and the inter-bat distance histogram of 5 different flight patterns. (A) Pie chart shows the percentage of time bats spent in each flight pattern. About 65% of the time one bat followed the other bat and more than half of the time, bats maintained an inter-bat angle smaller than 30°, which indicates that one bat was following another bat in a similar direction. (B–F) The x axis is the inter-bat distance (m) and the y axis represents the duration of silent and vocal times. Red bars represent the silent times and blue bars represent the vocal times at specified inter-bat distances. If the bat was silent more than vocal, the red bar exceeds the blue one. If the bat was vocal more than silent, the blue bars exceed the red. Overlap regions are indicated by purple bars. Note that the y axes in panels (B–F) do not display the same scales. (Upper Right Inset) The geometric configuration of each flight pattern. Arrows represent the flight direction of each bat. (B) When the bearing of both bats is at an acute angle, the flight pattern is referred to as converging flight. (C) When the bearing of both bats is at an obtuse angle, the flight pattern is referred to as diverging flight. (D–F) When the 2 bats are flying in the same general direction, the flight pattern is called following flight. We divided following flight into 3 separate patterns according to the inter-bat angle between paired bats. (D) Inter-bat angle between 0° and 30° is called 0–30° following. (E) Inter-bat angle between 30° and 60° is called 30–60° following. (F) Inter-bat angle between 60° and 90° is called 60–90° following.

