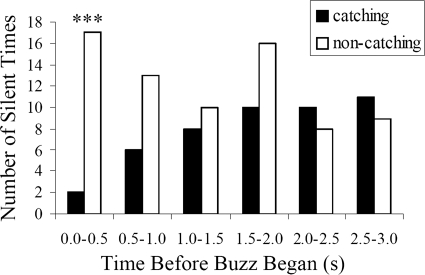
Fig. 5.
The relationship between prey capture and silent behavior. The number of silent times before the feeding buzz for both the bat that captured the worm and the bat that did not capture the worm. The x axis is the time a silent time ended before the beginning of the feeding buzz and y axis is the number of silent times. Black bars represent the bat that caught the worm and white bars represent the bat that did not catch the worm. χ2 test is applied to examine the difference of silent behavior between these 2 bats and *** means p < 0.001.

