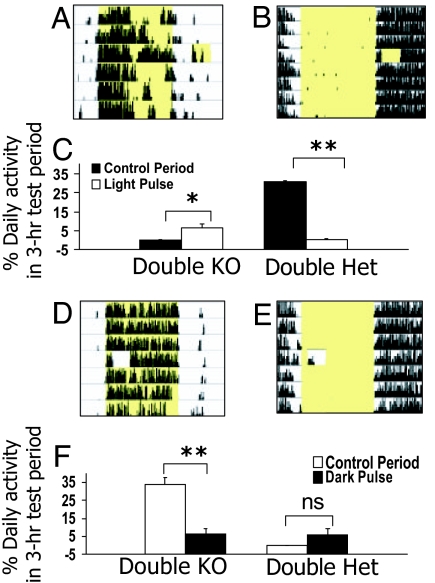
Fig. 2.
Masking responses to 3-h light or dark pulses. (A, B, D, and E) Representative 24-h running-wheel records of a double-knockout Rpe65−/−;Opn4−/− (A and D) and a double-heterozygous Rpe65+/−;Opn4+/− (B and E) mouse administered either a 3-h light pulse in the early night or a 3-h dark pulse in the early part of a LD12:12 cycle. Subsequent days are plotted one beneath the other on the y axis. Yellow shading indicates time of lights-on. (C and F) Histograms showing mean percentage of daily wheel revolutions (±SEM) during the 3-h light or dark pulse and during the same 3-h control period on the day before the pulse. *, P < 0.05; **, P < 0.001, Student's t test.

