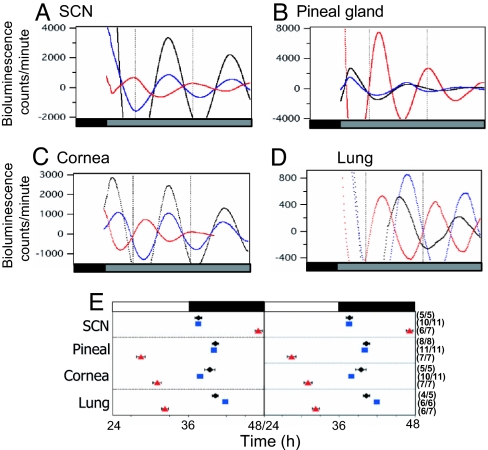
Fig. 4.
Real-time monitoring of mPER2::LUCIFERASE expression. (A–D) Representative records of detrended mPER2::LUC bioluminescence rhythms from different tissues of one diurnally entrained Rpe65−/−;Opn4−/−; mPer2luc mouse (red) and two nocturnal controls, a mPer2luc knockin mouse (black) and one Rpe65+/−;Opn4+/−;mPer2luc mouse (blue). (E) Peak phases of mPER2::LUC bioluminescence rhythms from SCN and pineal gland oscillators of mPer2luc knockin (black diamonds), Rpe65+/−;Opn4+/−;mPer2luc (blue squares), and Rpe65−/−;Opn4−/−;mPer2luc (red triangles) mice. Data are double plotted for ease of interpretation. The mean time of peak (±SEM) is plotted against the time of the light:dark cycle, which is indicated by black (dark) and white (light) bars above the graph, on the day of the tissue explant. The phase of the rhythm peak was determined during the 24–48 h interval after the start of each culture. The number of rhythmic cultures out of the number of total cultures tested is indicated in parentheses to the right of each data point.

