Fig. 2.
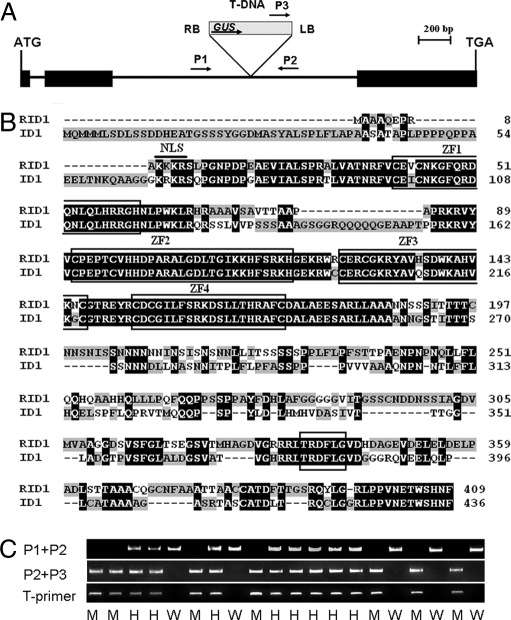
Molecular features of RID1. (A) Structure of RID1 and T-DNA insertion site. Three exons (filled boxes) and two introns (lines between the filled boxes) are shown. T-DNA was inserted into the second intron. Arrows indicate the primers used for analyzing the insertion site. LB and RB represent the left and right borders of T-DNA. (B) Alignment of amino acid sequences of RID1 and ID1 proteins. Clustalx software was used for the alignment. The identical amino acids are shown with white text on a black background. The “TRDFLG” motif and four zinc-finger motifs are boxed. A thick bar at the N-terminal region shows the putative nuclear localization signal motif. (C) PCR genotyping RID1 segregants with primers as indicated in A (Table S2): M, homozygous for T-DNA insertion; W, WT; H, hemizygous. Primers P1 and P2 flank the T-DNA insertion and amplify a product from homozygous or WT allele. PCR-positive plants with P2 and P3 indicate T-DNA insertion in the examined site. Presence of a product with P2 and P3 and not with P1 and P2 indicates a plant homozygous for the insertion. PCR-positive plants amplified by T-primers indicate T-DNA insertion.

