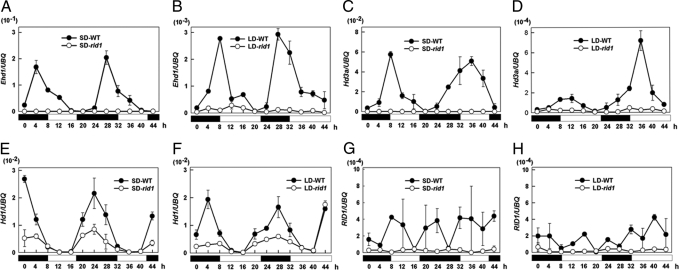
Fig. 4.
Diurnal expression patterns of RID1, Ehd1, Hd1, and Hd3a in WT (filled circles) and rid1 (open circles) plants under SDs (A, C, E, and G) and LDs (B, D, F, and H) by quantitative RT-PCR analysis. The expression levels are relative to the UBQ mRNA. The average values (means ± SEM) are based on two separate RNA extractions each with at least three technical repeats. The open and filled bars at the bottom represent the light and dark periods, respectively.

