Fig. 3.
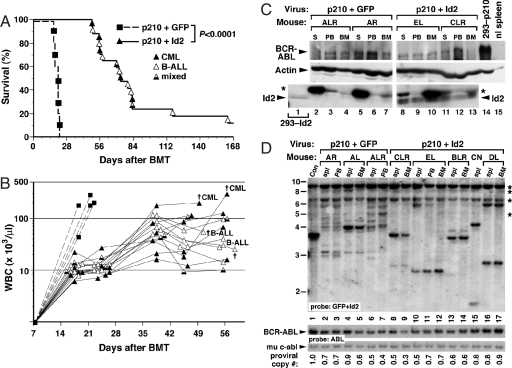
Co-expression of Id2 attenuates CML-like myeloproliferative disease induced by p210 BCR-ABL in mice. (A) Kaplan-Meier survival curve for recipients of bone marrow transduced with retrovirus co-expressing p210 BCR-ABL and GFP (dashed line, n = 5) or retrovirus co-expressing p210 and Id2 (solid line, n = 17). Individual mice are indicated by the symbols (squares = p210+GFP, triangles = p210+Id2), while the phenotype of the leukemia that each recipient developed is indicated by the shading (black = CML-like MPD, white = B-cell acute lymphoblastic leukemia (B-ALL), black/white = both diseases simultaneously). The difference in survival between the 2 cohorts was highly significant (P < 0.0001, Mantel-Cox test). The curve is a composite of 2 independent bone marrow transplantation experiments that gave similar results. (B) Scatter plot of peripheral blood leukocyte counts (y axis, logarithmic scale) versus time after transplantation (x axis) for a subset of the recipients in A. Symbols are the same as in panel A. The demise of several individual mice during this time interval and their leukemic diagnoses are indicated by the crosses. The sampling dates for several mice were altered on the graph by 1–2 days for clarity. (C) Western blot analysis of primary myeloid cell extracts from recipients of BCR-ABL-transduced BM. (Top) BCR-ABL levels, (middle) actin loading control, (bottom) Id2 levels. The pair of panels (p210+GFP and p210+Id2) for each antibody is from the same exposure of the same blot. Lane 1 is an extract from 293 cells transfected with an Id2 expression construct, demonstrating the position of Id2 protein. The asterisk indicates a non-specific band. Lanes 2–4 and 5–7 are extracts from spleen (S), peripheral blood (PB), and bone marrow (BM) from 2 representative mice with CML-like disease induced by p210+GFP retrovirus vector, while lanes 8–10 and 11–13 are from 2 representative mice with disease induced by p210+Id2 vector. ALR and AR refer to mice transplanted with hematopoietic progenitors expressing p210+GFP. EL and CLR refer to mice transplanted with hematopoietic progenitors expressing p210+Id2. Mouse EL was killed for analysis on day 29 posttransplant with moderate leukocytosis and splenomegaly, while mouse CLR died of CML-like leukemia. Lane 14 is an extract from 293 cells expressing p210 BCR-ABL, while lane 15 is an extract from normal mouse splenocytes. Note the considerable overexpression of Id2 protein (detectable here as 2 distinct species) in recipients of p210+Id2 virus-transduced marrow. (D) Southern blot analysis of proviral integration. Genomic DNA from spleen (spl), peripheral blood (PB), or BM of leukemic mice was analyzed by Southern blot with a mixture of GFP and Id2 probes to detect distinct proviral integration events (top panel), and subsequently with an ABL probe (bottom panels) to determine the total proviral content of each sample (40). The bands indicated by asterisks (right) arise from the murine Id2 gene. Con (lane 1) is control DNA from a cell line containing a single BCR-ABL provirus. Lanes 2–7 show the clonality of CML-like leukemia in p210+GFP recipients, while lanes 8–17 are representative leukemia samples from p210+Id2 recipients. ALR, AL and AR refer to mice transplanted with hematopoietic progenitors expressing p210+GFP. CLR, EL, BLR and DL refer to mice transduced with hematopoietic progenitors carrying p210+Id2.

