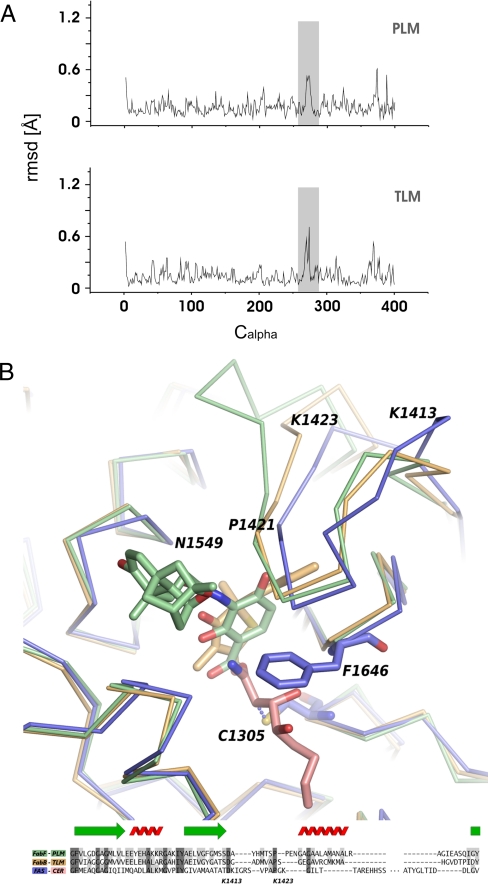
Fig. 4.
TLM and PLM. (A) Induced fit binding of TLM and PLM. Root mean squared deviations between FabF with and without PLM (PDB codes 2GFX and 2GFV) and FabB with and without TLM (PDB codes 1FJ8 and 1FJ4). (B) Superposition of the FabF–PLM (green) and FabB–TLM (gold) complexes onto the FAS–CER structure (blue/red). A structure-based sequence alignment around the FAS KS loop, K1413–K1423, is included for reference.

