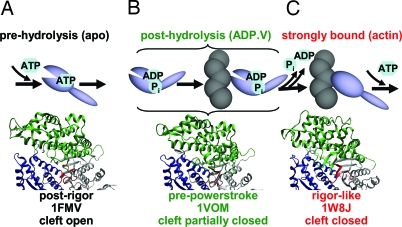
Fig. 1.
Actomyosin ATPase cycle (simplified and linearized) illustrating proposed changes in the actin-binding cleft, assuming tight coupling between biochemical states (listed at the top, with ligands used to produce these states in the present study in parentheses) and structural states defined by crystal structures (shown at bottom). 1FMV: Dicty myosin II, apo (5). 1VOM: Dicty myosin II, ADP.V (6). 1W8J: myosin V, apo (7). The illustration uses the following color scheme: green, U50; blue, L50; red, nucleotide pocket.

