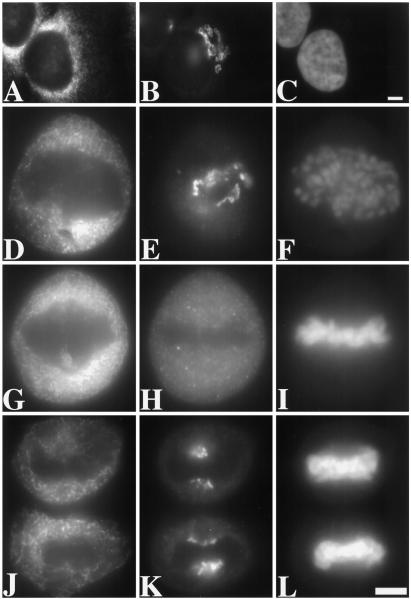
Figure 1.
Examination of triply stained interphase and mitotic HeLa cells by fluorescence microscopy. The staining pattern of the ER marker protein p63 (A, D, G, and J), the Golgi marker protein giantin (B, E, H, and K), and the DNA stain Hoechst 33258 (C, F, I, and L) is shown for cells at interphase (A–C), prometaphase (D–F), metaphase (G–I), and late anaphase (J–L). To allow direct comparison, each label was viewed at the same focal plane. Compared with the Golgi staining, the ER staining was significantly more reticular and was excluded from a larger area near the condensed chromosomes. The pictures shown are representative of hundreds of different cells examined at the different stages of division. Bars, 25 μm.

