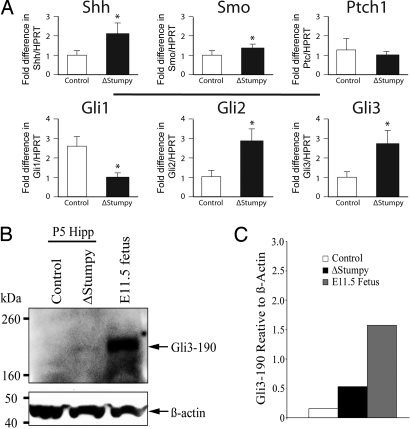
Fig. 4.
Altered mRNA levels of Shh pathway genes and changes in Gli3 processing. (A) Expression levels of Shh pathway genes in hippocampus using qRT-PCR. Levels of Shh, Smo, Ptc, and Gli1–3 were normalized to levels of HPRT. *P < 0.05 (Student's t test). (B) Western blot showing the levels of full-length Gli3 (∼190 kDa) in P5 hippocampus (Hipp) of control and ΔStumpy compared to E11.5 fetus. Note the absence of a detectable band in the control lane. Shown below is the β-actin loading control. (C) The blot in (B) was repeated in triplicate and the graph shows the average intensity of Gli3-190 signal relative to β-actin signal for the indicated groups.

