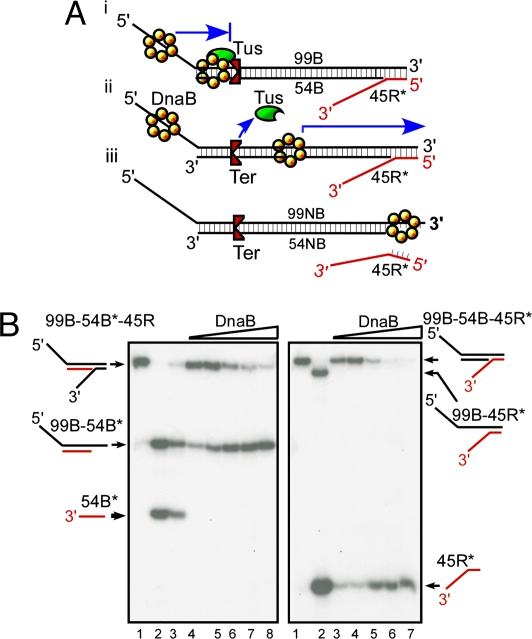
Fig. 2.
Experimental strategy for determining DnaB sliding on dsDNA and its arrest at a Tus–Ter complex. (A) Diagram showing the triplex substrates used for measurements of helicase sliding in the blocking orientation that arrests a sliding DnaB and is measured by the unwinding of the 45R reporter oligo (i) and the substrate with the nonblocking orientation of Ter (ii and iii). (B) Phosphorimagergrams showing the products generated by sliding of DnaB on 99B-54B*-45R triplex (Left) and on the 99B-54B-45R* (Right) (* indicates the location of the labeled 5′ end) triplexes in the absence of Tus. The labeled strands are shown in red. Three to four femtomoles of substrate DNA and 0–300 ng of DnaB were used in each reaction. (Left) Lanes 1–3, marker DNA; lanes 4–8, 0, 50, 100, 300, and 400 ng of DnaB, respectively. (Right) Lanes 1 and 2, marker DNA; lanes 3 and 4, DNA without DnaB; and lanes 5–7, 50, 100, and 300 ng of DnaB, respectively.

