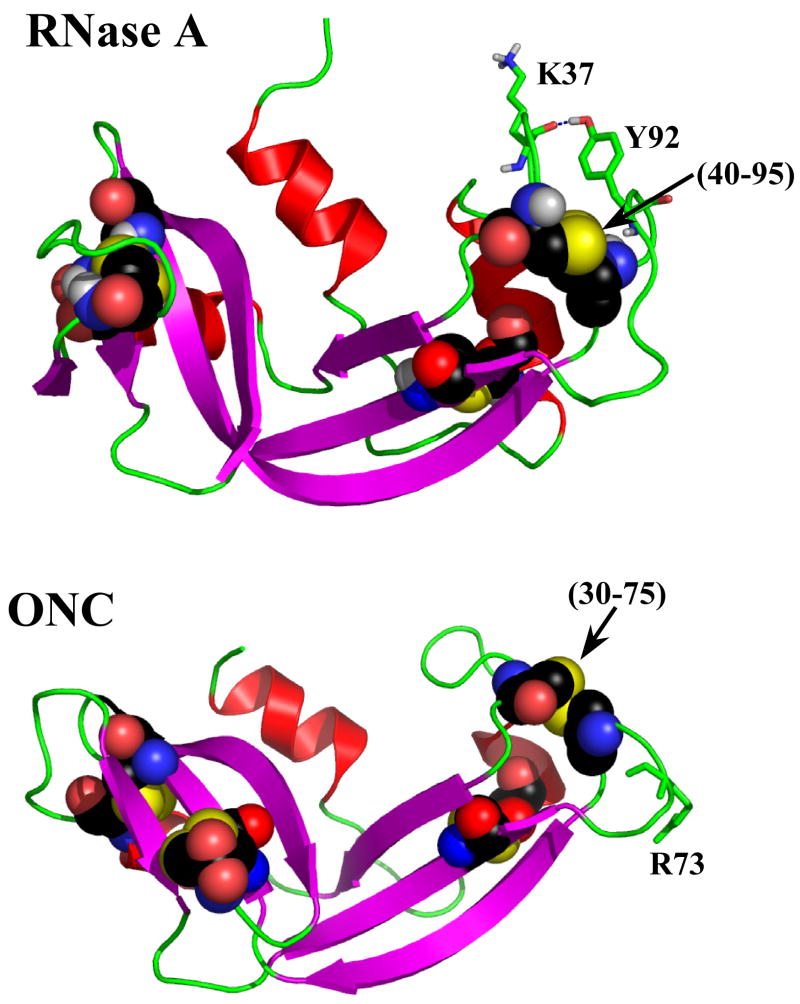
Figure 1.
Structures of WT RNase A (7RSA) and onconase (1ONC). All cysteines in each protein are depicted using the “space fill” representation in an element-based coloring format. Additionally, the (40–95) and (30–75) disulfide bonds which are homologous to each other are labeled. The Tyr92 and Lys37 in RNase A, and Arg73 in ONC are depicted using “stick” representation.

