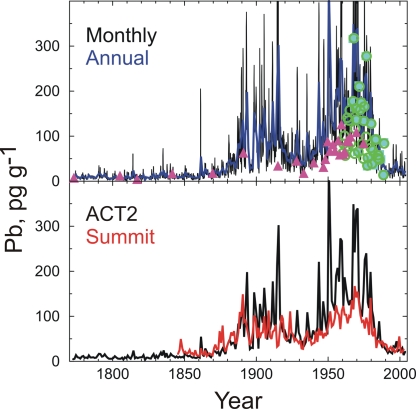
Fig. 6.
Comparisons to other Greenland ice core measurements of Pb. (Upper) Comparison of monthly and annually averaged Pb measurements from ACT2 with previously published discrete measurements [filled circle (11), filled triangle (13), open circle (14)] at Summit ≈600 km north of ACT2. (Lower) Comparison of annually averaged continuous Pb measurements from ACT2 and Summit. Concentrations of Pb at ACT2 are higher than at Summit after industrialization, particularly in the second half of the 20th century.

