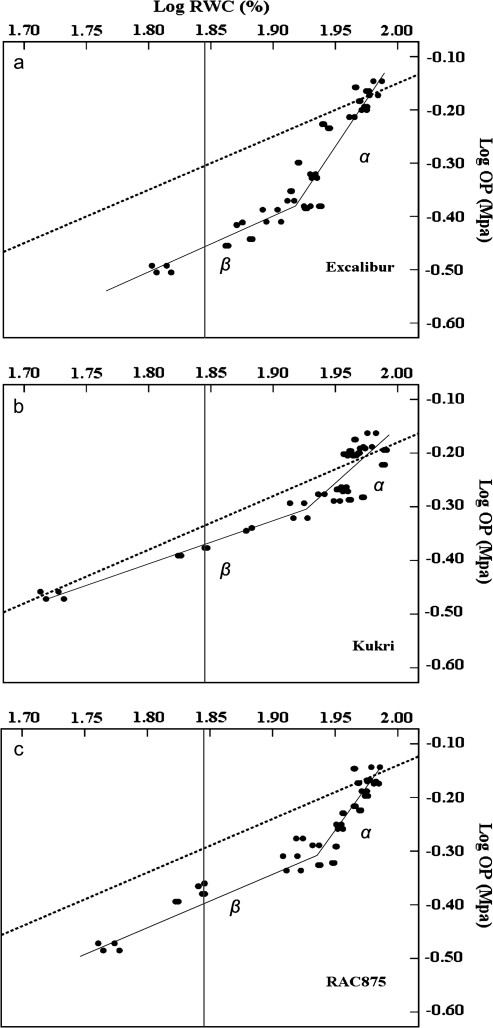
Fig. 4.
The linear regressions of osmotic potential (OP) and relative water content (RWC) in log scale. Relationship between RWCand OPfor flag leaves of Excalibur (a), Kukri (b), and RAC875 (c). The dashed line is the response of an ideal osmometer and the solid line is the actual fit for RWCversus OP. The vertical grey line is the logarithm of RWC=70%. There are two linear phases: in the first phase (α), there was little change in RWCas OPdeclined, while in the second phase (β), RWCdeclined linearly with OP. Three cultivars were grouped according to their response to high (a), low (b), and medium (c) osmotic adjustment (OA).

