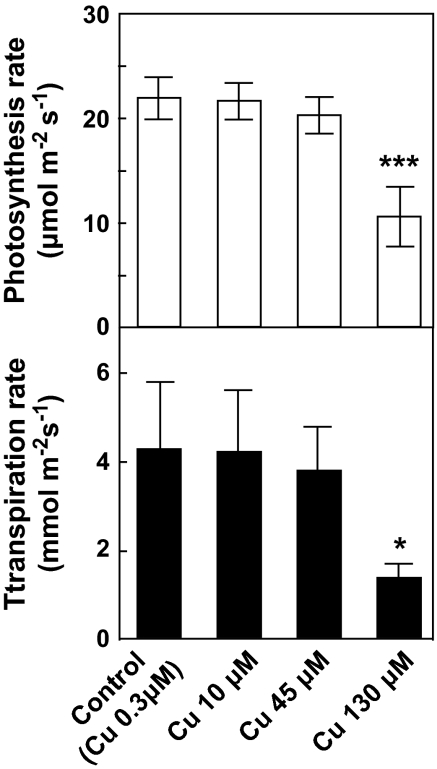
Fig. 2.
Photosynthetic and transpiration rates after CuCl2 treatment. Values are the means ±SD of three individual leaves. The statistical significance was determined by Dunnett's multiple comparison tests. Asterisks indicate a significant difference compared with control (*P < 0.05, **P < 0.01, ***P < 0.001).

