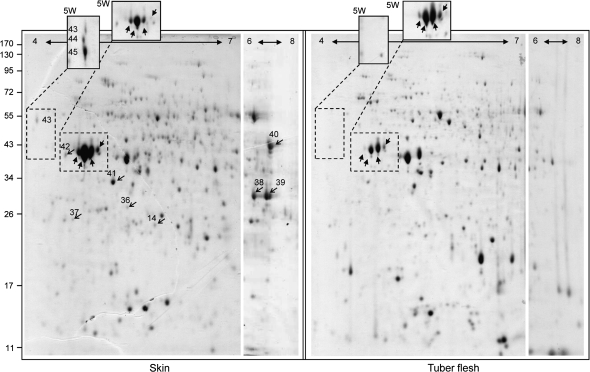
Fig. 2.
Representative 2-DE images of skin and tuber flesh at the developmental stage of 8 weeks post-sprout-emergence. Left frame: skin proteome. Right frame: flesh proteome. Each frame is a composite of three gels: the larger image represents 2-DE with a (linear) gradient interval of pH 4–7, the narrow gel on the right is a segment of the 2-DE gel with a (non-linear) gradient interval of pH 3–11 showing only the pH range of 6–8. The pH gradient intervals are indicated by a horizontal arrow at the top of each photograph. The third component of each frame is two boxes that protrude above the main image. These boxes were taken from 2-DE (pH 4–7) images of skin and flesh samples that were collected at 5 weeks post-sprout-emergence (5W); dashed lines indicate the corresponding spots in the main image. The left protruding box in the skin frame encloses spots with POP_A sequences (spots 43–45); the right protruding box in each frame encloses patatin spots. Light arrows indicate peroxidase and CCoAOMT isozymes verified by RT-PCR, block arrows indicate major patatin proteins.

