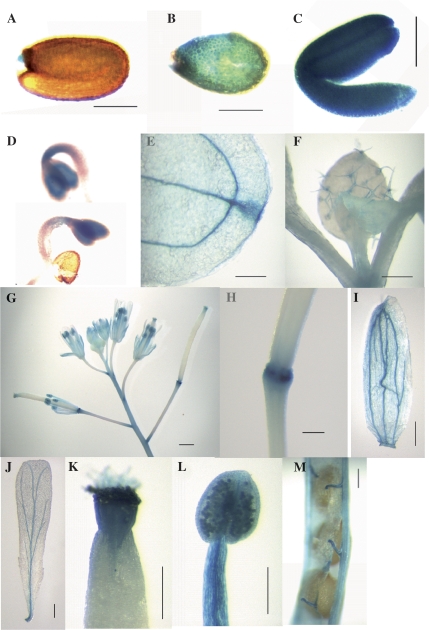
Fig. 2.
Localization of GUS protein in transgenic A. thaliana plants expressing GUS from the AtSCP2 promoter. (A) Seed, (B) endosperm, (C) embryo, (D) 2-d-old seedlings, (E) cotyledon hydathode, (F) trichomes, (G) flowers, (H) receptacle, (I) sepal, (J) petal, (K) style, (L) pollen grains, anther and filament, (M) funiculus. GUS activity is visualized by the blue colour. The bar correspond to 200 μm (H, K), 250 μm (A–C, I, J, L), 500 μm (M), 1 mm (F, G) or 2 mm (E).

