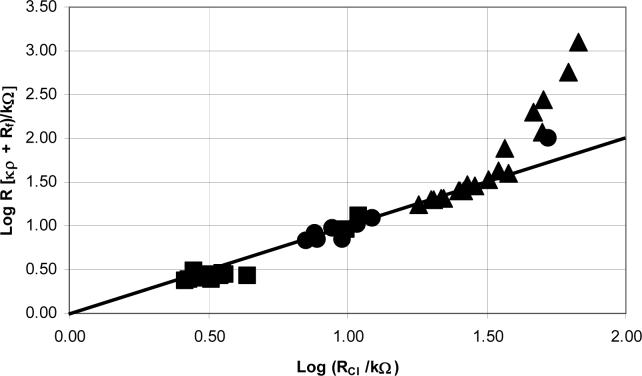
Figure 6.
A log plot of κρ + Rf vs. the resistance values from current interruption experiments. The diagonal line on the graph represents perfect correlation with a slope of 1. The approximate conductivities of the solutions used in the current interruption experiments: ● 100 mM KCl (13,000 μS/cm), ■ 10 mM KCl (1,500 μS/cm), ▲ and Iso (400 μS/cm).

