Figure 1.

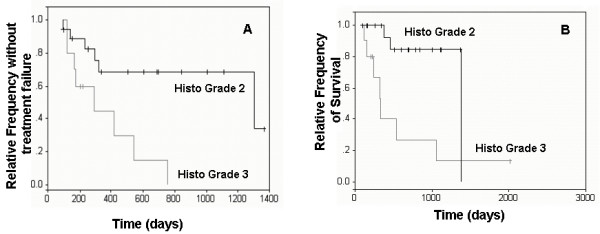
Survival curves of dogs with histologic grade 2 and 3 MCTs. Kaplan-Meier survival curves comparing disease-free interval (A) and overall survival times (B) of dogs with histologic grade 2 and 3 MCTs.

Survival curves of dogs with histologic grade 2 and 3 MCTs. Kaplan-Meier survival curves comparing disease-free interval (A) and overall survival times (B) of dogs with histologic grade 2 and 3 MCTs.