
Figure 4.
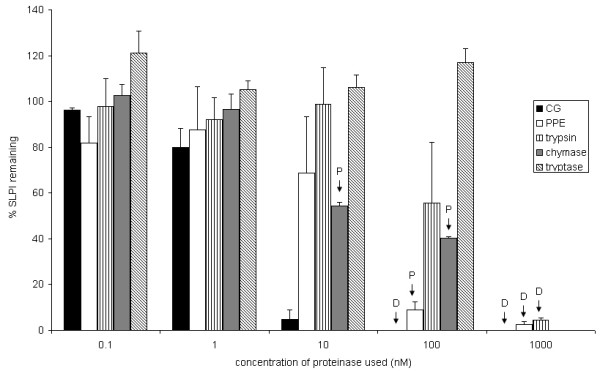
Effect of other proteinases on SLPI concentration in A549 cells. A549 cells were cultured with varying concentrations of each proteinase for 24 h. The concentration of SLPI, expressed as a percentage of the concentration in serum free media, is shown on the y axis with the SEM represented by error bars. P indicates that the cells exhibited morphological changes of partial detachment, 'rounding up' and losing attachment to each other but remaining adherent to the culture plate, whilst D indicates that the cells detached completely from the culture plate. The effect on SLPI concentration was only independent of cell morphology for CG. Values given are mean ± SEM for at least 3 experiments.