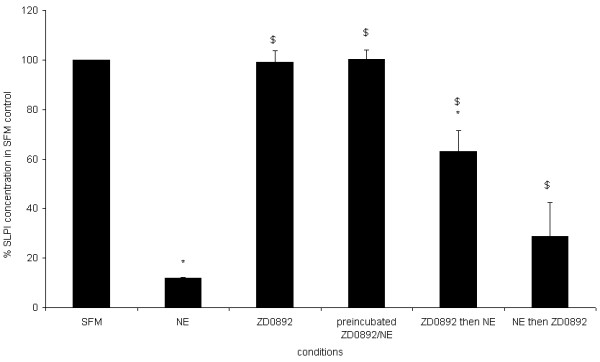
Figure 6.

Timing of the addition of inhibitor to NE affects concentration of SLPI. The diagram shows the concentration of SLPI in the media of wells treated according to the conditions shown on the x axis. The concentration of SLPI is expressed as % of the concentration in control wells. * indicates significant difference from control wells, $ indicates significant difference from NE-treated wells. Values shown are mean ± SEM for 3 experiments. Prior incubation of NE with a tenfold excess of ZD0892 completely abrogated the effect of NE on SLPI concentration. When NE and ZD0892 were added separately, there was a fall in SLPI concentration which was less pronounced than that seen with NE alone, but still significantly different from both media control and NE alone. Although the average fall was greater when NE was added before rather than after ZD0892, this difference was not statistically significant.
