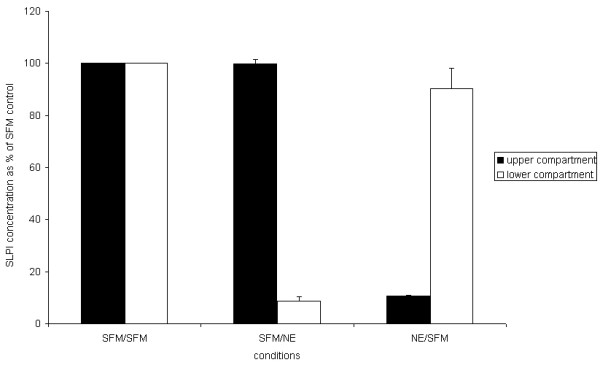
Figure 8.

The effect of NE on SLPI concentration in media of cells grown on Transwells. The diagram shows the concentration of SLPI in each compartment of A549 cells grown in Transwells, relative to the concentration in control wells. Wells were treated with either 10 nM NE or serum free media (SFM) alone for 10 minutes, and the concentration of SLPI was then determined by ELISA. Upper and lower compartment results for the same well are adjacent; the solid bars indicate upper compartments and the open bars indicate lower compartments. SFM/NE indicates that NE was applied to the lower compartment only whilst NE/SFM indicates that NE was applied to the upper compartment only. The concentration of SLPI in the NE-treated compartments fell significantly (p = 0.001 by independent t-test) from 100% to 10.6 ± 0.3% (NE added to upper compartment) and 8.6 ± 1.9% (NE added to lower compartment) whilst there was no difference in concentration of the paired SFM-treated compartments (99.9 ± 1.5% and 90.31 ± 7.8% of control wells respectively).
