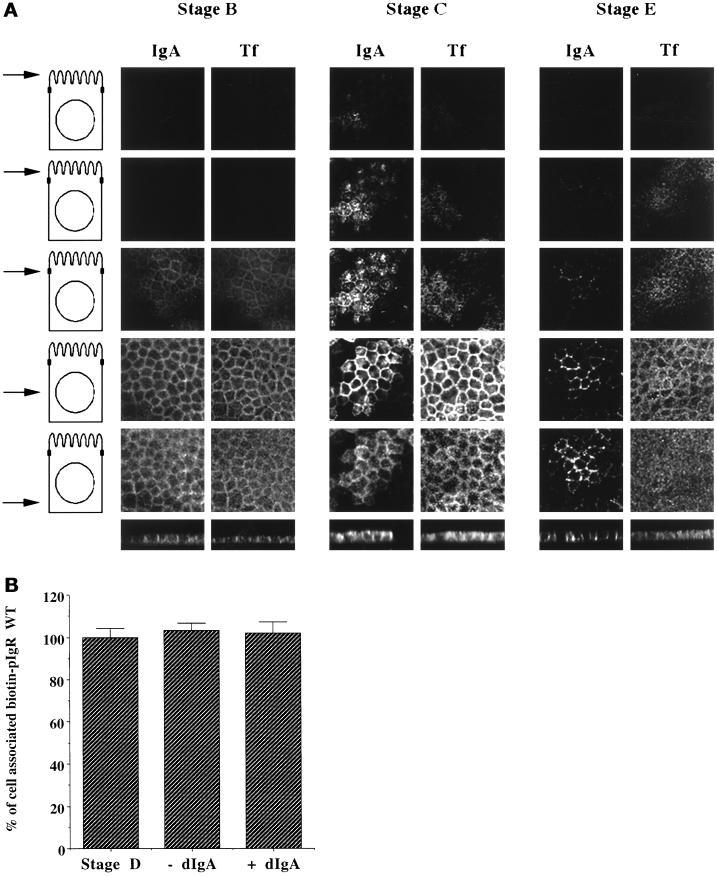
Figure 2.
Controls for the postmicrotubule-dependent assay. (A) Micrographs of MDCK cells at stage A, D, or E of the postmicrotubule-dependent assay described in Figure 1. Staining for dIgA and Tf are compared. The top five rows are horizontal (X–Y) sections taken at various levels of the cells. On the left side a schematic of an MDCK cell is shown, with an arrow indicating where the section was taken with respect to the nucleus and ZO-1 staining. The two top rows were sections taken 1 and 2 μm, respectively, above the tight junctions, as defined by ZO-1. The third row is at the level of the tight junctions. The fourth row is at the middle of the nucleus, whereas the fifth row is beneath the nucleus. The bottom row shows vertical (X–Z) sections through the cell. (B) The cells were biotinylated at 4°C and then either exposed or not exposed to dIgA at 4°C, corresponding to stages A and B of the postmicrotubule-dependent assay. Stage C was omitted. As in stage D, the cells were then either treated or not treated with nocodazole for 1 h at 4°C. The cells were finally warmed at 37°C for 35 min to allow the apical transport of the pIgR, as in stage E of the postmicrotubule-dependent assay. Usually stage E is a 20-min step, but we chose 35 min to compensate for the 15 min of stage C that was omitted. n = 2; p > 0.5 for all samples.

