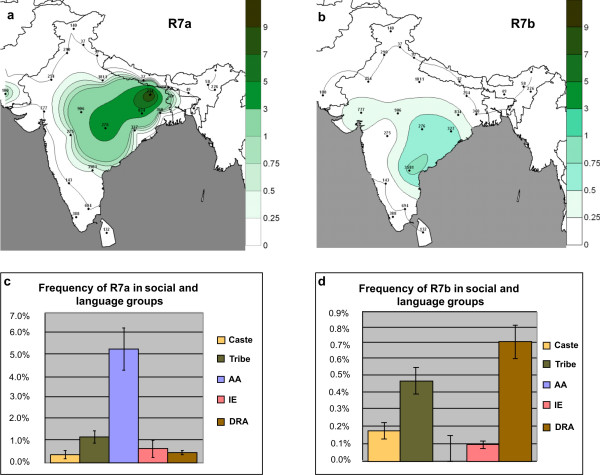
Figure 4.
The frequency distribution of R7a and R7b clades in Indian subcontinent. The upper panel (a, b) shows the spatial distribution (%) of these clades in Indian populations. Isofrequency maps were generated by using Surfer7 of Golden Software (Golden Software Inc., Golden, Colorado), following the Kriging procedure. These isofrequency maps illustrate the geographic spread of the respective mtDNA haplogroups. It should be cautioned, however, that these illustrative maps should not be used to predict the frequency of the clade in geographical areas with missing data. The lower panel (c, d) depicts the frequencies of R7a and R7b in different social and language groups. DRA-Dravidian, AA-Austro-Asiatic, IE-Indo-European.

