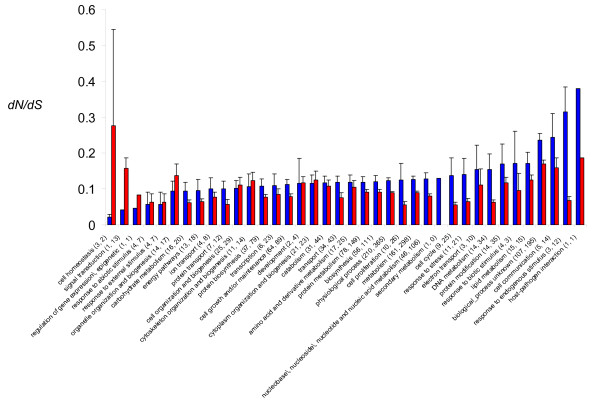
Figure 2.
Evolutionary rates (dN/dS) and Gene Ontology Processes in hominid (blue bars) and rodent (red bars) Plasmodium lineages. The numbers between parentheses are the number of genes belonging to each group. The first number corresponds to the hominid lineage; the second corresponds to the rodent one.

