Figure 3.
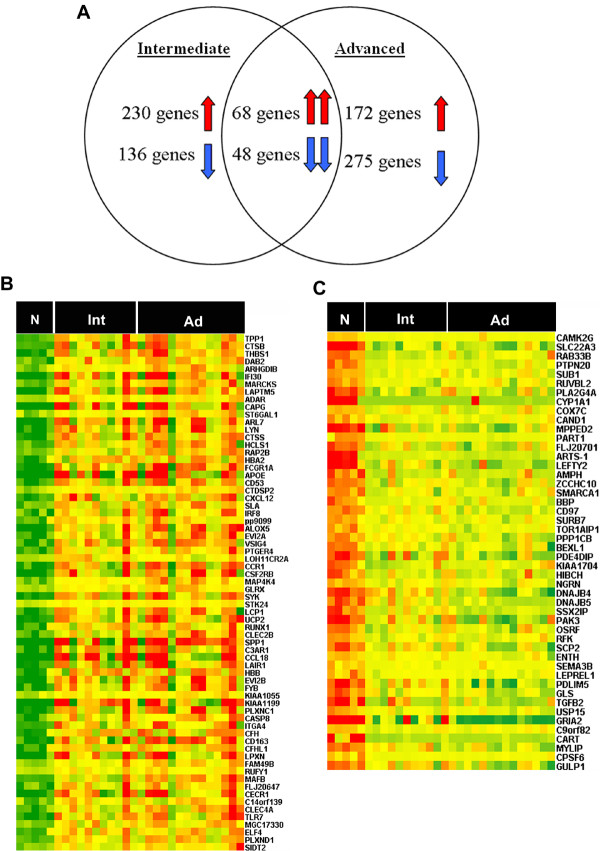
Over-represented genes in both intermediate lesions and advanced lesions. A. The genes whose expressions were significantly changed in intermediate lesions and advanced lesions, respectively, are shown in a Venn diagram. B, C. Heatmap representation of commonly up-regulated genes (B) and commonly down-regulated genes (C) in overlapping genes, respectively. Samples are displayed in columns and genes in rows. Gene expression is represented as a color, normalized across each row, with brighter red for higher values and brighter green for lower values. Gene symbols are listed to the right. N (Normal control group), Int (intermediate lesions group), Ad (advanced lesions group).

