
Figure 1.
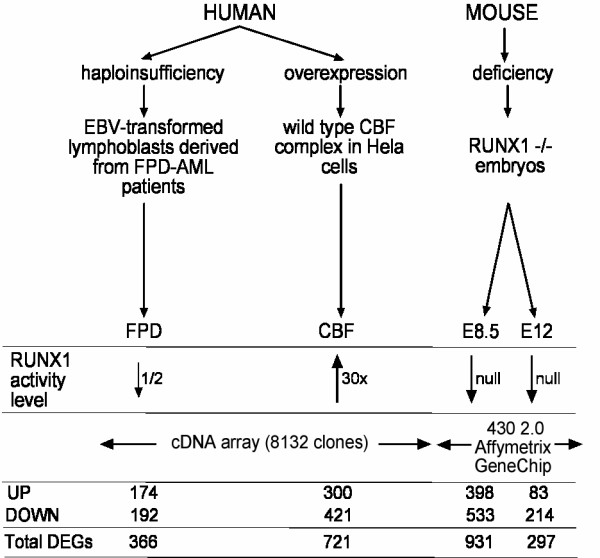
Gene expression profiles and overlaps. The three platforms used in this study are indicated. The number of up-, down- or all differentially expressed genes (DEGs) are indicated below each platform.
Official websites use .gov
A
.gov website belongs to an official
government organization in the United States.
Secure .gov websites use HTTPS
A lock (
) or https:// means you've safely
connected to the .gov website. Share sensitive
information only on official, secure websites.
Gene expression profiles and overlaps. The three platforms used in this study are indicated. The number of up-, down- or all differentially expressed genes (DEGs) are indicated below each platform.