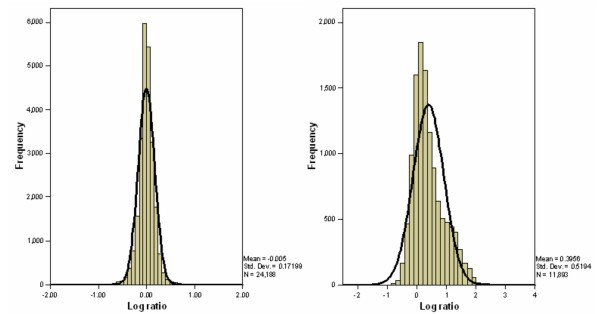
Figure 1.
Distribution of log-transformed ratio of gene expression data in breast cancer and DMH data in A2780 cell line. The left histogram shows the distribution of log-transformed ratios (cy3/cy5) in gene expression profiling data from a previous study of breast cancer 36] which is symmetric, while the right histogram shows the log-transformed ratios (undigested/digested) of DMH data from the present study which is skewed.

