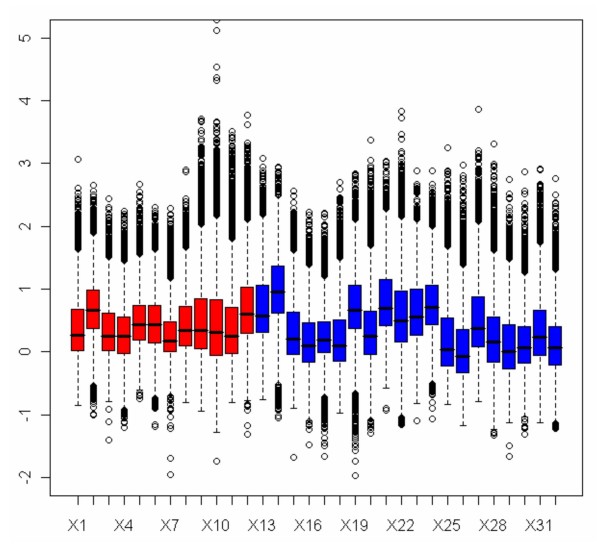
Figure 4.
Box plot of log ratios of undigested signal intensities against digested signal intensities in 16 cell lines (dye-swapped arrays). The boxes colored in red are the A2780 sensitive cell lines; in blue are the A2780 resistant cell lines. As normalisation is not applied, the center and scale of log ratios for the 16 cell lines are not at the same level.

