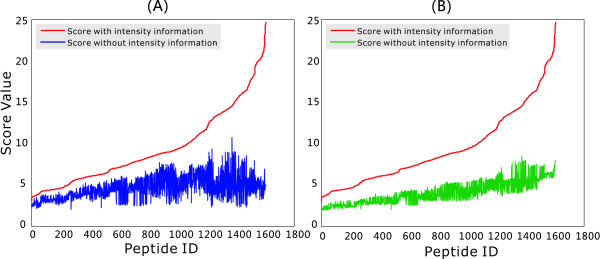
Figure 7.
Comparison of scores with/without intensity information on all test peptides. Similarity scores are computed using Eq. 1. The higher a score, the more similar the predicted spectrum is to the experimental counterpart. Figure 7-A: The red line represents the sorted scores calculated with the predicted intensity information. The blue line represents the corresponding scores calculated without intensity information. The two score use the same variances predicted by the Bayesian neural network model. Figure 7-B: The red line represents the sorted scores calculated with the predicted intensity information. The blue line represents the corresponding scores calculated without intensity information. Variances for intensity-free scores are set to 1.

