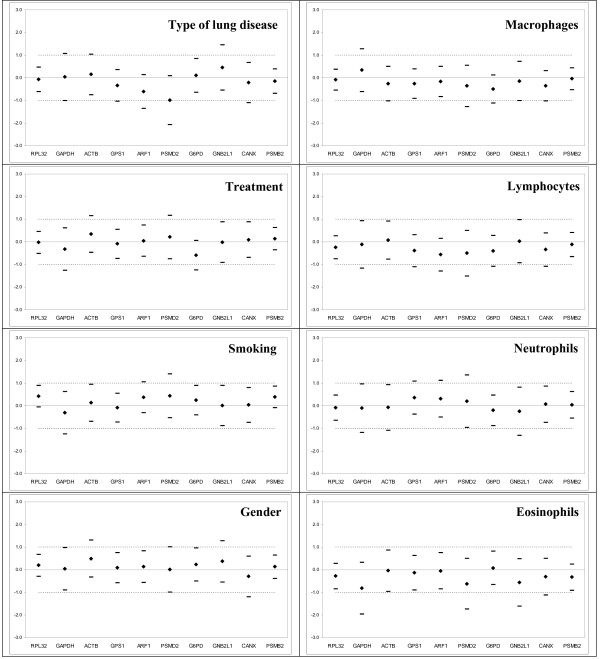
Figure 2.
Equivalence test for ten housekeeping genes in the 1st cohort subgroups based on the type of lung disease, treatment, smoking status, gender, and bronchoalveolar lavage cellular composition. Differences of the means (◆) and matching symmetrical confidence intervals (-) are shown for the log2-transformed relative expression of HKGs. Y-axis represents the fold change in expression among subgroups. The deviation area [-1; 1] for a fold change ≤ 2 lies within the dashed lines. If the symmetrical confidence interval is a part of the deviation area and contains zero in them, the gene is considered to be expressed equivalently. For more details on calculation see the Additional files and for statistical methodology the references [23,24]. Mean differences were calculated as follows: Mean(interstitial diseases)-Mean(other lung diseases), Mean(treated)-Mean(untreated), Mean(males)-Mean(females), Mean(smokers)-Mean(non-smokers), and Mean(pathological BAL cell counts)-Mean(normal BAL cell counts) for macrophages, lymphocytes, neutrophils and eosinophils. Reference BAL cell counts were based on own laboratory values and correspond to Meyer [21], for more details see Methods section.

